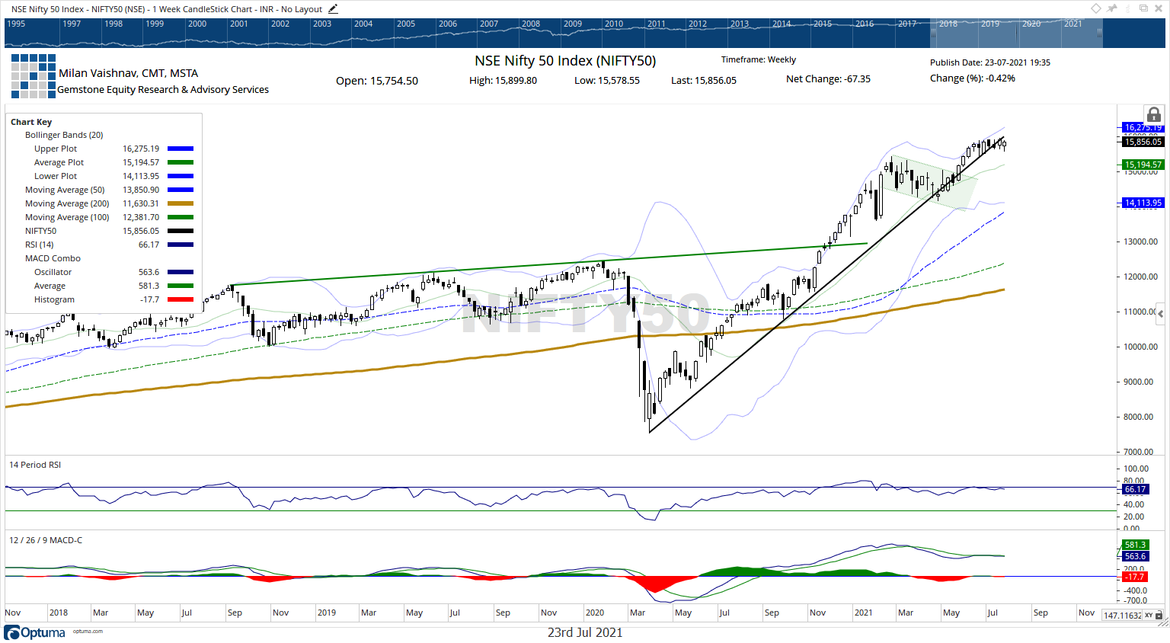
Following a volatile week, the NIFTY finally took some breather as it traded within a defined range before closing with modest losses. The first half of the week saw sharp corrective moves from the higher levels; the second half of the week saw the NIFTY rebounding on the back of sharp short-covering which took the markets again towards the upper edge of the consolidation range. Despite efforts, NIFTY failed to move past its previous highs; it finally ended with a net loss of 67.35 points (-0.42%) on a weekly basis.

The weekly charts do not present a good picture. The NIFTY has formed a lower top and lower bottom on the weekly charts; importantly, it is still below the rising trend line support that it has violated in the previous week. This trend line was a support earlier, now broken, has become resistance. It begins from the lows formed in March 2020 and it joins the subsequent higher bottoms. Given the rising nature of this trend line, it will become all the more difficult for the markets to move above it with each passing week. The volatility remained unchanged; INDIAVIX rose by a marginal 0.49% to 11.7600.
The coming will see the NIFTY struggling hard between 15900-16000 levels. The levels of 16000 and 16065 will act as potential resistance points in the event of any up move. The supports come in lower at 15700 and 15610. While the upsides will stay capped so long as the NIFTY is below the 16000 levels; any corrective move will make the trading range wider than usual.
The Relative Strength Index (RSI) is 66.17; it stays neutral and does not show any divergence against the price. The weekly MACD is bearish and remains below the signal line. A candle resembling a Hanging Man occurred on the charts. It is a bearish indication especially when it emerges near the high point. The present candle is not a classical Hanging Man as the lower shadow is no as long as it should be. Ideally, it should be at least thrice the size of the real body.
All in all, the NIFTY has a serious resistance to clear in the form of 15900-16000 zones. So long as the Index is below this range, it will remain vulnerable to profit-taking bouts from higher levels. The longer-term charts also show the markets being overextended; this will keep all upsides capped and vulnerable to selling pressures from higher levels. Although aggressive shorts are not advised as yet, all longs should be once again be kept limited to defensive and low beta stocks. While trailing stop-losses in a very strict way, a selective and cautious approach is advised for the coming week.
In our look at Relative Rotation Graphs®, we compared various sectors against CNX500 (NIFTY 500 Index), which represents over 95% of the free float market cap of all the stocks listed.


The review of Relative Rotation Graphs (RRG) shows that there is no single sector in the leading quadrant which may take the lead and in the coming days. NIFTY PSU Bank Index, Small Cap, Media, and Energy Index are inside the leading quadrant. But all seem to be paring their relative momentum against the broader markets.
NIFTY PSE Index has now rolled inside the weakening quadrant. NIFTY Midcap, Commodities, and Metal indices inside the weakening quadrant. They are likely to relatively underperform the broader NIFTY500 Index.
NIFTY Infrastructure index is inside the lagging quadrant along with NIFTY IT and NIFTY Financial services index. However, they appear to be consolidating and may give stock-specific relative outperformance against the broader markets.
Banknifty has rolled inside the improving quadrant. Apart from this, NIFTY Auto, FMCG, Consumption, and Realty Index are inside the improving quadrant; these groups may show relative outperformance against the broader markets.
Important Note: RRG™ charts show the relative strength and momentum for a group of stocks. In the above Chart, they show relative performance against NIFTY500 Index (Broader Markets) and should not be used directly as buy or sell signals.
This was first published by The Economic Times.
Milan Vaishnav, CMT, MSTA
Consulting Technical Analyst
Member: (CMT Association, USA | CSTA, Canada | STA, UK) | (Research Analyst, SEBI Reg. No. INH000003341)
Categories
RECEIVE FREE! – Weekly Market Outlook and all Special Articles when published

