The equity markets had an overall positive week, but the broad sentiment remained quite tentative as the NIFTY oscillated both ways during the five trading sessions before ending on a positive note. The index saw itself breaking out of the 16400-15700 trading range which is broad enough in its own way; however, it suffered a throwback and consolidated again in a narrow range. The trading range also remained a bit narrow; against the 511-point range in the week before this one, the NIFTY oscillated in a lesser, 355-point range. While largely staying positive, the index did not take any major step higher. The headline NIFTY50 closed with a net gain of 231.85 points (+1.42%) on a weekly basis.

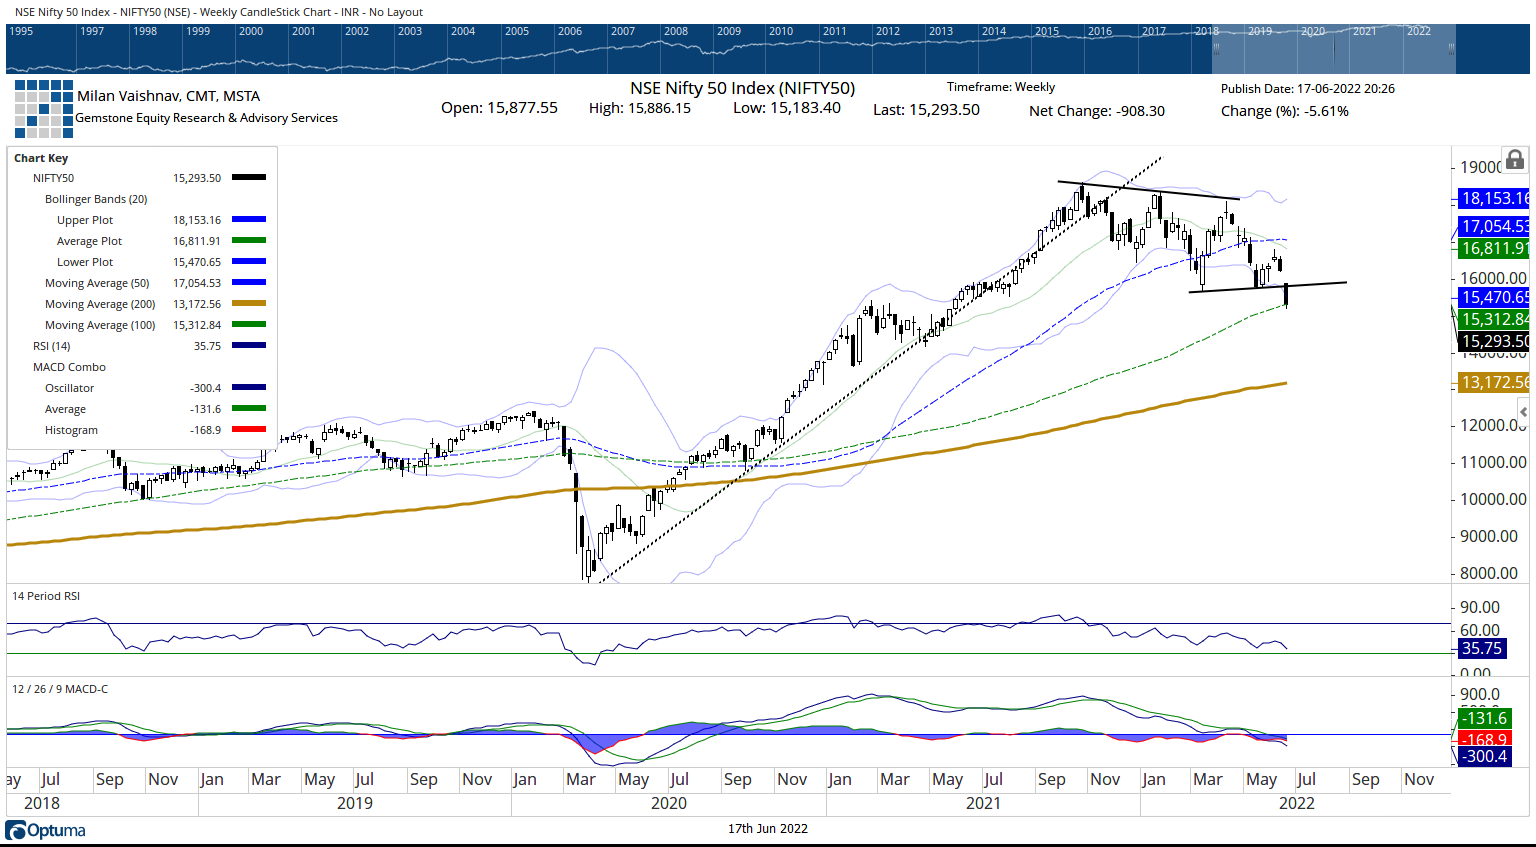
From the technical perspective, the breakout above 16400 levels has made this level the immediate support level for the NIFTY in the near term. Besides this, the NIFTY so far has held the double bottom formed near the immediate low point of this range. The most immediate resistance that the index has is the 50-Week MA which presently stands at 17056; this again makes the zone of 16400-17000 yet another trading zone for the index. Apart from this, volatility too declined during the week; INDIAVIX came off by 7.01% to 19.98.
The coming week stays crucial for the markets. The index trades in a narrow trading zone; it will require a comprehensive push above the 17000 levels. The levels of 16700 and 16950 will act as immediate resistance levels; the supports are expected to come in at 16520 and 16380 levels.
The weekly RSI is 46.47; it shows a mild bullish divergence against the price. The weekly MACD is bearish and stays below the signal line. A spinning top emerged on the candles; this shows the tentative and indecisive behavior of the market participants.
The pattern analysis shows that the Index trades below the 50-Week MA which stands at 17056. However, it trades above the 200-, and the 100-Week MAs. The move toward the 50-Week MA will also take the index to a very important pattern resistance; this pattern resistance is the trendline that was violated by NIFTY on its way down.
All in all, we may continue seeing the markets trading tentatively. It is largely expected that the markets will continue to stay highly stock-specific in nature. We may see isolated stock-specific outperformance from all the sectors rather than any particular sector dominating during the week. It would be extremely important to stay with the right kind of stock. It is recommended that the focus should be to avoid shorts and make use of the dips, if any, to make entries in stocks that are showing improvement in their relative strength. We can expect a good show from pockets like Energy, PSE, Consumption, IT, etc. over the coming days.
In our look at Relative Rotation Graphs®, we compared various sectors against CNX500 (NIFTY 500 Index), which represents over 95% of the free float market cap of all the stocks listed.


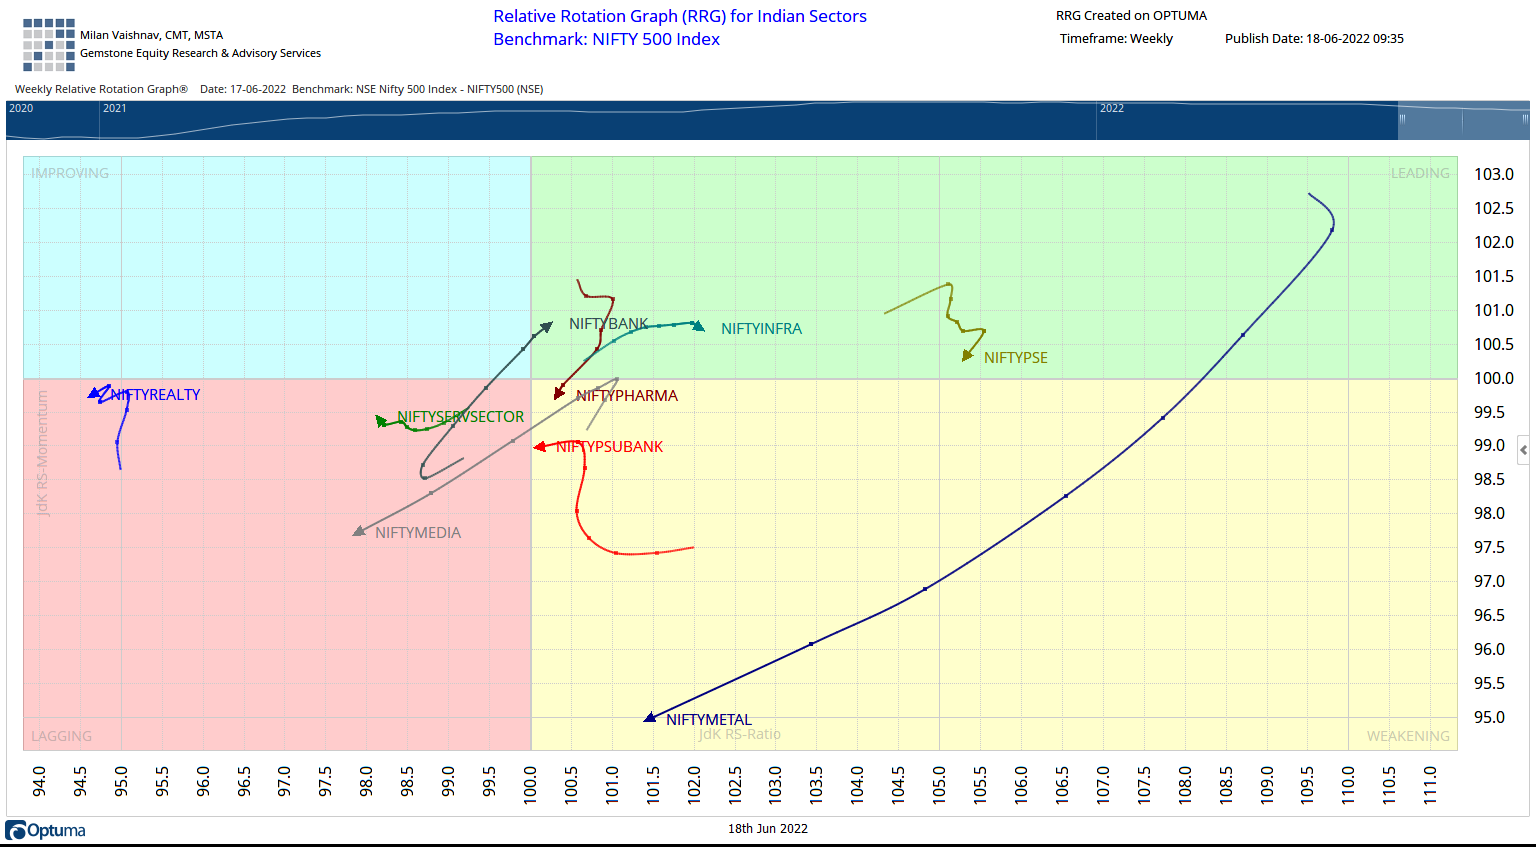
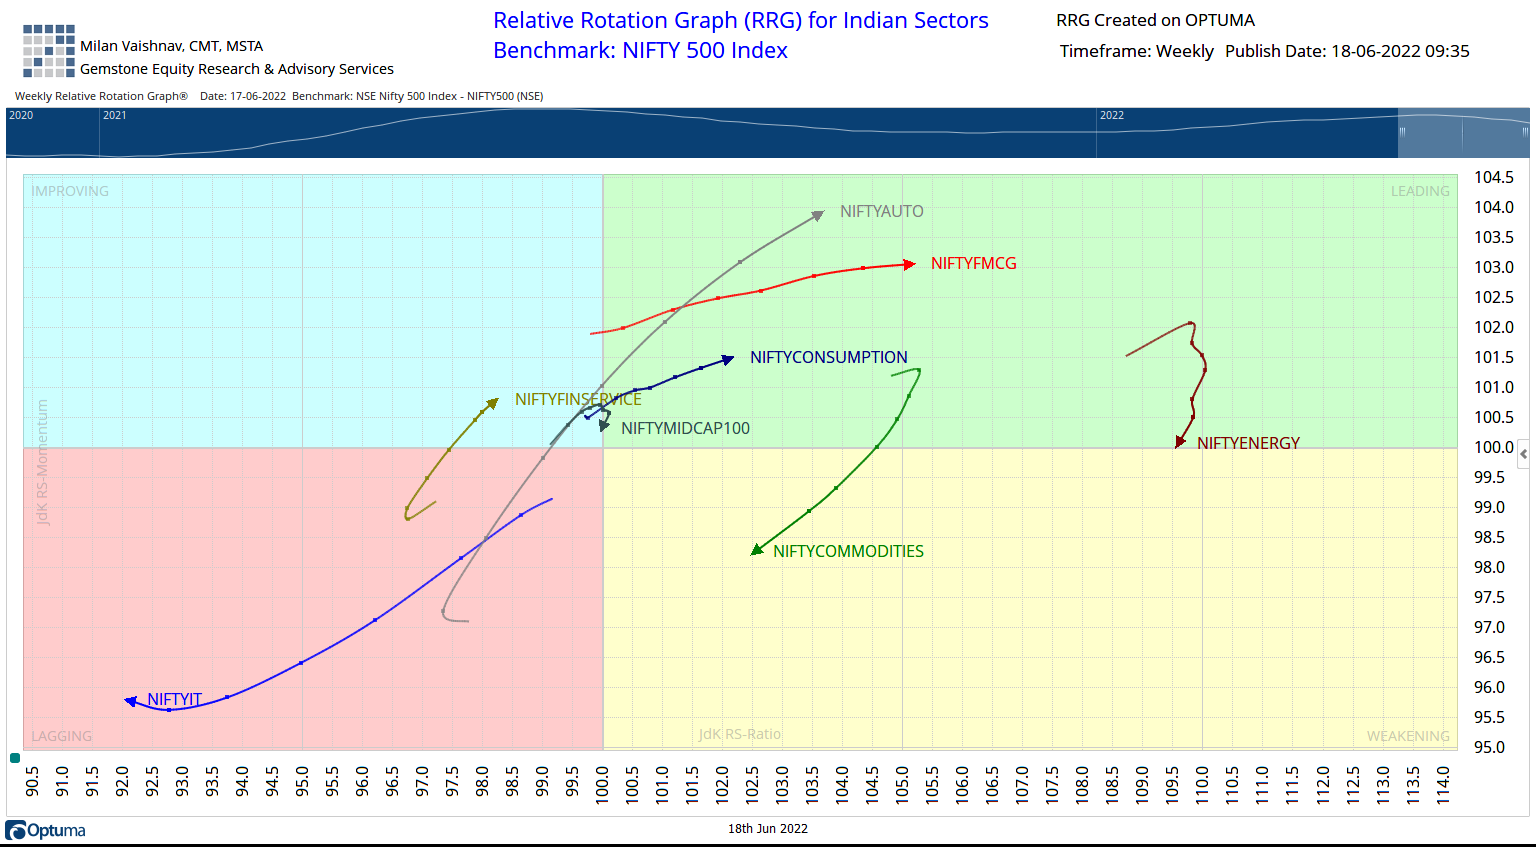
The analysis of Relative Rotation Graphs (RRG) shows some pockets losing strength in terms of their momentum against the broader markets. The Metal Index has drifted further lower inside the weakening quadrant. Besides this, the Realty Index that had rolled inside the improving quadrant in the previous week has sharply lost its relative momentum and has rolled back inside the lagging quadrant. We may see these pockets relatively underperforming the broader NIFTY500 Index.
The NIFTY Consumption, FMCG, Infrastructure, Pharma, PSE, Commodities, and the Midcap 100 indexes are inside the leading quadrant. However, few among these groups are seen slightly giving up on their relative momentum against the broader markets.
NIFTY Media has rolled back inside the weakening quadrant; PSUBank continues to stay in the weakening quadrant as well.
NIFTY Services sector and NIFTY IT indexes stay inside the lagging quadrant. These pockets may see relative underperformance against the broader markets but some stock-specific shows from these groups may not be ruled out.
Both Banknifty and Financial Services indexes have rolled inside the improving quadrant.
Important Note: RRG™ charts show the relative strength and momentum for a group of stocks. In the above Chart, they show relative performance against NIFTY500 Index (Broader Markets) and should not be used directly as buy or sell signals.
This was first published by The Economic Times.
Milan Vaishnav, CMT, MSTA
Consulting Technical Analyst
Member: (CMT Association, USA | CSTA, Canada | STA, UK) | (Research Analyst, SEBI Reg. No. INH000003341)
Categories
RECEIVE FREE! – Weekly Market Outlook and all Special Articles when published


