Volatility Index, VIX, often comes into the limelight in periods of heightened volatility in the markets. Presently, the India Volatility Index, INDIAVIX, witnessed a lifetime high of 86.64. From the closing high of 83.61, this Index, which is also known as a fear gauge, has come off by nearly 60% to 33.99.
There are a few of the common mistakes that people make while understanding and interpreting the VIX. Before we dig deeper, it is essential to understand the INDIAVIX Index, is a volatility index based on the NIFTY Index Option prices. It uses the computation methodology of CBOE after a few adaptions in the Indian context. Many factors go into the computation, few of them being time-to-expiry, Interest Rates, The Forward Index Level, Bid-Ask quotes, etc.

Under ideal conditions, the headline index NIFTY50 and INDIAVIX have an inverse relationship. This means they usually move in opposite directions. However, there are times when the NIFTY and the VIX often move in the same direction and send conflicting signals as to its interpretation. Periods of sustained lower values of the VIX represents periods of high complacency of the market participants, and they have been often associated with major market tops.
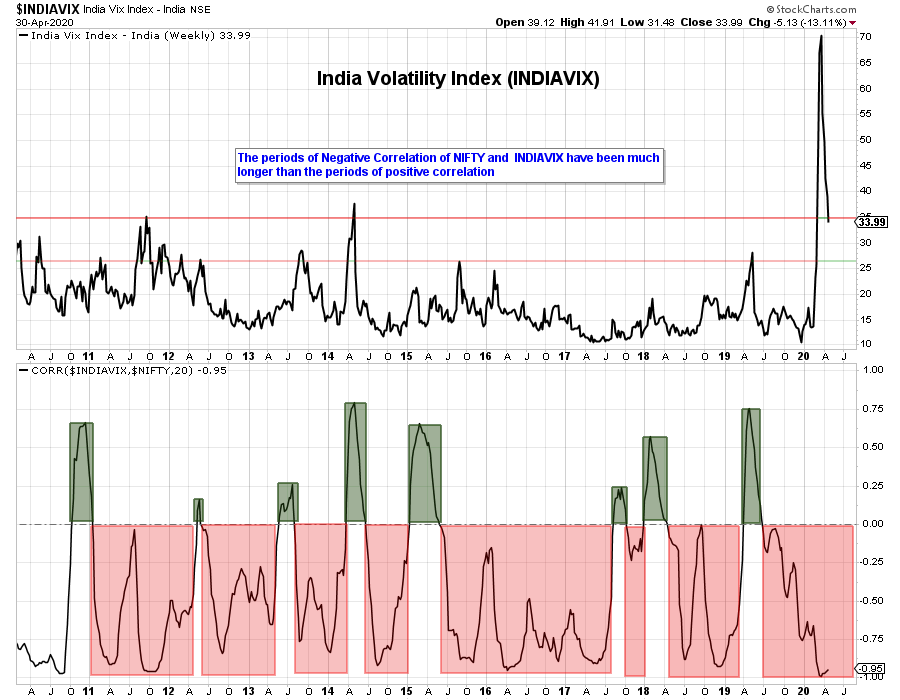
The above chart shows INDIAVIX, and the bottom half shows its correlation with NIFTY. As evident from the above chart, there have been times when the correlation has been positive (meaning, VIX, and NIFTY moving in the same direction). However, for the majority of the time, the correlation has been negative, representing an ideal relationship between the two. Presently, the correlation remains strongly negative.
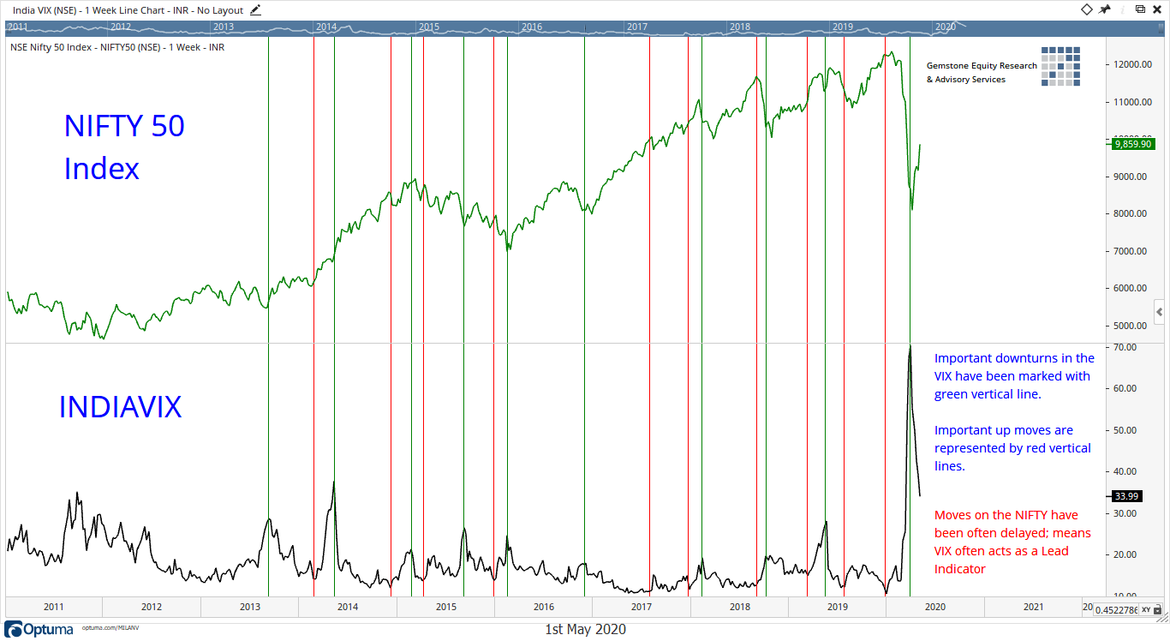
Also, it has been observed many times that the reversal of trend or a move in VIX comes earlier, and after that, it is reflected on the Index.

In the above chart, major downturns of INDIAVIX are represented by green lines. The red lines show the starting points of important up moves in the INDIAVIX values. Regardless of the positive or negative correlation of VIX and NIFTY, it is also observed that the turns in the VIX have preceded the moves in the NIFTY for most of the time. In other words, it has acted as a lead indicator for the majority of the time as well.
The conclusion that we can draw from here is – INDIAVIX should not be singularly interpreted. A high value is not a reason enough for the markets to bottom out; similarly, a low value is not a sufficient reason for any market to top out.
For any reliable and meaningful analysis of the Volatility Index, it is always advisable to wait for any change of trend in the Index. Also, it makes sense that this reading is accompanied by an analysis of the headline index, which is corroborated with other pieces of technical pieces of evidence.
In the present technical setup of the NIFTY, just that the INDIA VIX has come off by 60% from its closing high will not mean that the NIFTY may slip into a correction. However, the fact that the INDIA VIX has come off by 60% from its closing peak and it is accompanied by the NIFTY testing the decade-old pattern resistance of a rising trend line makes a more meaningful observation through the use of VIX.
Given the current technical structure, some incremental volatility creeping in again in the markets should not come as a surprise.
This was first published by The Economic Times.
Milan Vaishnav, CMT, MSTA
Consulting Technical Analyst
Member: (CMT Association, USA | CSTA, Canada | STA, UK) | (Research Analyst, SEBI Reg. No. INH000003341)
Categories
RECEIVE FREE! – Weekly Market Outlook and all Special Articles when published

