On Monday, currencies across Emerging Markets saw themselves weakening against the US Dollar. This weakness had Turkish crises to blame as the Turkish Lira has lost nearly a quarter (25%) of its value against the US Dollar ever since the spat between Turkey and the US broke out. This happened due to the continued detention of an American pastor in Turkey, pushing the economy toward a full-blown financial meltdown
The rupee touched its fresh high today against the US Dollar. However, if for a while, if we put the Turkish crisis aside, there is another major reason for us to worry about. The Turkey Crisis may fade away with the passage of time however, there are certain major technical developments on the US Dollar Index Chart that warrant our attention.

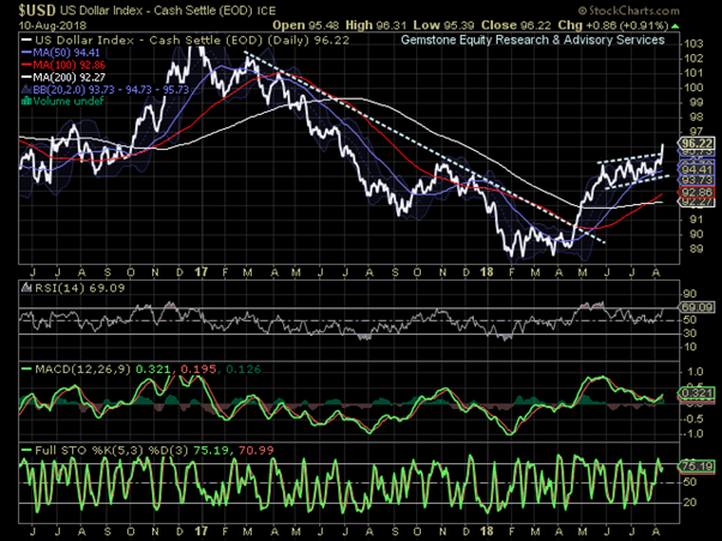
The chart shown above is the Daily Chart of the US Dollar Index which has achieved a strong breakout. After consolidation in the 89-91 zones, the US Dollar Index reversed its trend after remaining in a corrective falling channel since marking highs around 103. After a brief consolidation in 93.50-95.50 zones, it gave a breakout. The logical resolution of this breakout is likely seen in the 98-100 zones.
Since both the Week and the Month have not ended and there be changes in the current bar if we plot it, we have not included them. However, even if the Dollar Index maintains the levels of 94.75-95.10, we have a strong structure on the Weekly and Monthly Charts as well.
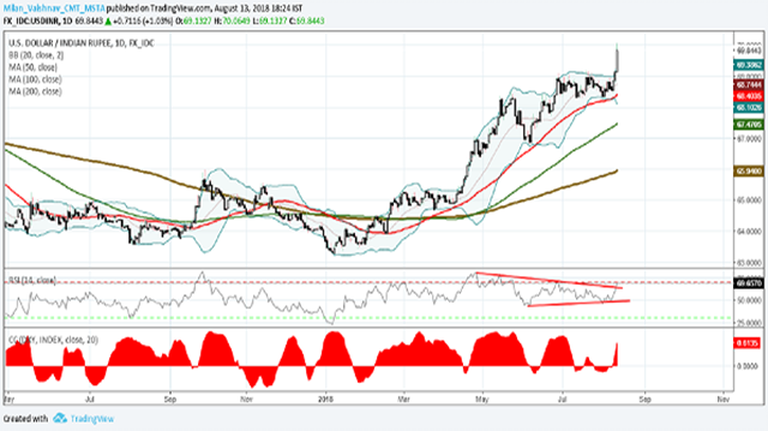
The Indian Rupee has always seen a strong correlation with the US Dollar Index. On average it enjoyed around the Correlation of 0.70. It is obvious that a strong US Dollar is bound to affect Indian Rupee but the study of the technical structure of the Charts may add more pain to it.

If we look at the Weekly and Monthly Charts of INR, it remains slightly extended and slightly overbought. So, we may see INR consolidating the higher levels. The Turkish crisis happened and will go away. But this strong technical development on the US Dollar Index Charts is likely to make the Rupee weaker over the coming months.
This may not happen overnight, and we might see INR trading in a broad range at higher levels but overcoming Weeks and Months, it would not be surprising to see INR seeing significant depreciation going ahead testing the values of Rs. 73-74.
Milan Vaishnav, CMT, MSTA
Consulting Technical Analyst
Member: (CMT Association, USA | CSTA, Canada | STA, UK) | (Research Analyst, SEBI Reg. No. INH000003341)
Categories
RECEIVE FREE! – Weekly Market Outlook and all Special Articles when published

