The Volatility Index – more commonly known as VIX is a measurement of the market’s expected volatility in the future. Analysts and Investors alike look at this tool to measure sentiment while making investment decisions. It reflects market participants’ psychology of greed and fear and it is often referred to as “Fear Gauge” or “Fear Index”.
 
The correlation between Indian VIX and the benchmark NIFTY50 is typically negative. We would always find VIX at its low levels when the index is at its high point and VIX at high levels when the markets are trying to find a bottom.
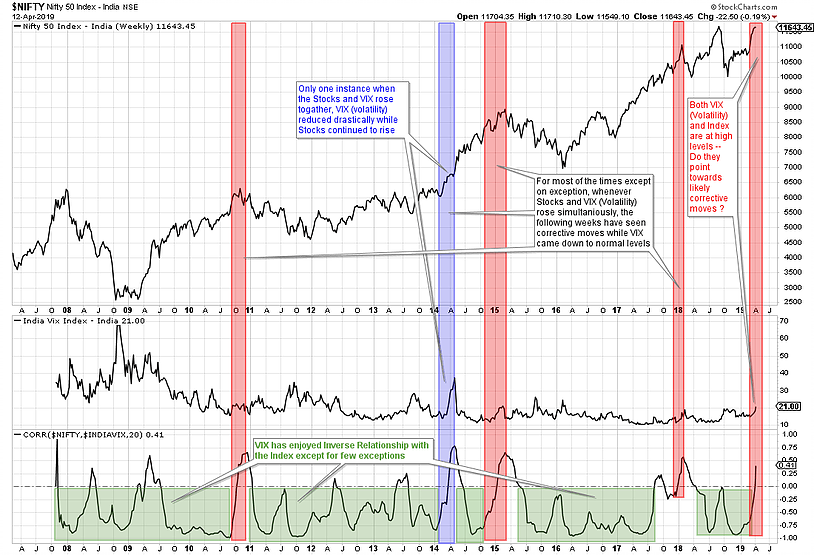
The chart shown above is the Weekly chart of the NIFTY50 Index. It is plotted along with the VIX and the last section of the charts show a correlation between NIFTY and VIX.
It is evident that for the majority of the time over the last decade, NIFTY has typically seen a strong negative correlation with VIX which is quite normal. However, over the past couple of weeks, we have seen this historical negative correlation go awry. It has been thrown off-balance as both NIFTY and VIX are rising together over the past weeks the correlation between the two has turned strongly positive.
 
At this point, it is important to note that the correlation turns positive even with the NIFTY and VIX falling simultaneously. However, history suggests that it has turned positive in the past more because of NIFTY and VIX rising together.
 
It would be very important and critical to examine the fallout whenever the NIFTY and the VIX have risen simultaneously.
 
Though it is difficult to pinpoint the exact number of occurrences due to the volatile moves VIX gives, we find 5 such occurrences including the present one wherein the correlation between NIFTY and VIX has become strongly positive because they moved up together.
We exclude the present occurrence as it has not been concluded yet. But if we examine the past 4 occurrences, it was only once in 2014 that both Stocks and VIX rose; VIX came down sharply as volatility decreased and the Stocks continued to inch higher.
 
In the case of the remaining 3 occurrences; in 2010, 2014-15, and in 2017-18, both Stocks and VIX rose together. But when the VIX declined and volatility reduced, it also brought down the Index along with it and the Markets saw corrective moves ranging from 3% to 8% approximately.
 
Conclusion: Over the past couple of weeks, we have seen VIX and NIFTY rising together. If we try and take few clues from history, Volatility, i.e. the VIX is definitely likely to come down over the coming weeks. However, though not with certainty, there are much higher chances unless there is an exception like it occurred in 2014, it also brings NIFTY down along with it. The only caveat is — 2014 too was a general election year and so is 2019. Apart from this, the NIFTY is always prone to undergo corrective moves whenever it has defied its inverse relationship with VIX.

This was first published by The Economic Times.

Milan Vaishnav, CMT, MSTA
Consulting Technical Analyst
Member: (CMT Association, USA | CSTA, Canada | STA, UK) | (Research Analyst, SEBI Reg. No. INH000003341)

Categories

RECEIVE FREE! – Weekly Market Outlook and all Special Articles when published

* indicates required