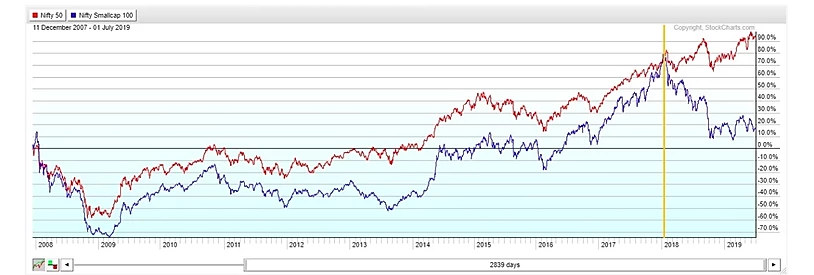
Over the last couple of months, we have seen the NIFTY Small Cap 100 Index under-performing the headline NIFTY Index. If we analyze its recent performance, the previous 6-months have seen the NIFTY returning 8.76% while the NIFTY Small Cap 100 Index has lost 3.71%. The last 12-month performance of these two indexes paints a similar picture. While the NIFTY has gained around 11.34%, the NIFTY Small Cap Index has lost 12.53%.


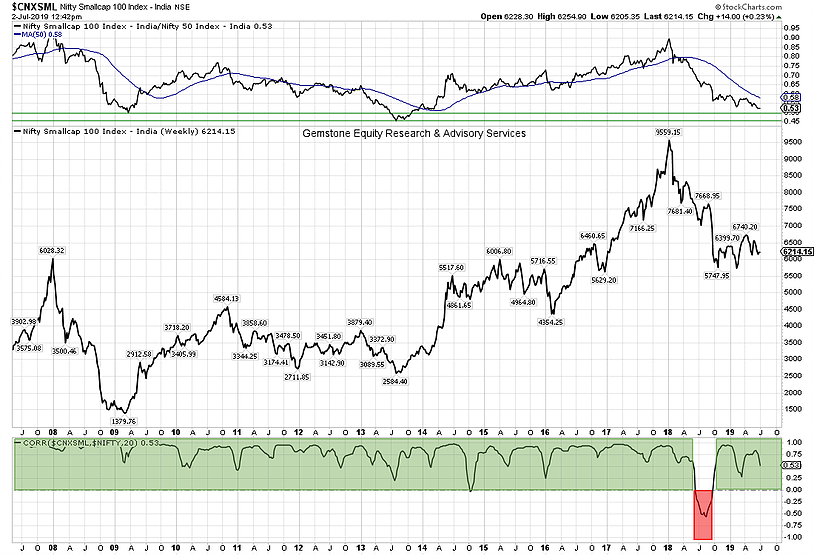
It is grossly evident that the Nifty Small Cap index has enjoyed a positive correlation with the NIFTY for most of the previous ten years. The above 10-Yr Weekly Chart of the Nifty Small Cap Index shows that except for the few months of 2018, where the correlation turned negative, the relationship between these two indices has remained positive.
That the under-performance to the NIFTY begin in 2018 is also shown by the RS Line which changed its trajectory with the start of 2018 and slipped below its 50-DMA.
This RS Line is approaching its 10-Yr long pattern support lines. This means that the Small Cap Index is set to arrest the under-performance that it has seen against NIFTY.
The situation of RS Line, when compared against NIFTY near its major long-term pattern support lines, can come in two ways. Either the NIFTY may take a breather, and in the meantime, the Small Cap Index catches up; or both the indexes rise with the Small Cap improving with a better momentum against the NIFTY.
In either case, the improvement in the Small Cap index is very likely, and if the small caps start rising while the NIFTY not marking fresh highs, this may also result in the front-line markets taking a breather in the near term.
Milan Vaishnav, CMT, MSTA
Consulting Technical Analyst
Member: (CMT Association, USA | CSTA, Canada | STA, UK) | (Research Analyst, SEBI Reg. No. INH000003341)
Categories
RECEIVE FREE! – Weekly Market Outlook and all Special Articles when published

