Gold prices have shown a great up move over the past several weeks. The precious metal has been marking new highs ever since it broke above the $ 1750 mark. Over the previous month, Gold has gained over $121 or 6.80 % on a monthly basis as of the week ending Friday, July 24th. Though the monthly bar is yet to be completed, there may not be any significant change in these figures and the yellow metal is on its way to posting one of its best monthly gains over the recent past.
Is the current rally in Gold a direct threat to Equities? The answer is NO. It may act as very early signs of cooling off in the equity markets but poses no direct threat in the immediate short-term.
The equity, as an asset class, is on its way to its own stable rotation against other asset classes. The equity markets may take some breather, or consolidate, but this would be governed by its own technical factors and not by the rally in Gold even if the asset has enjoyed a negative correlation against the equities for most of the time.
The rally in Gold can directly be attributed to weakness in the US Dollar. Rather than using words, let us use a couple of charts to explain this.
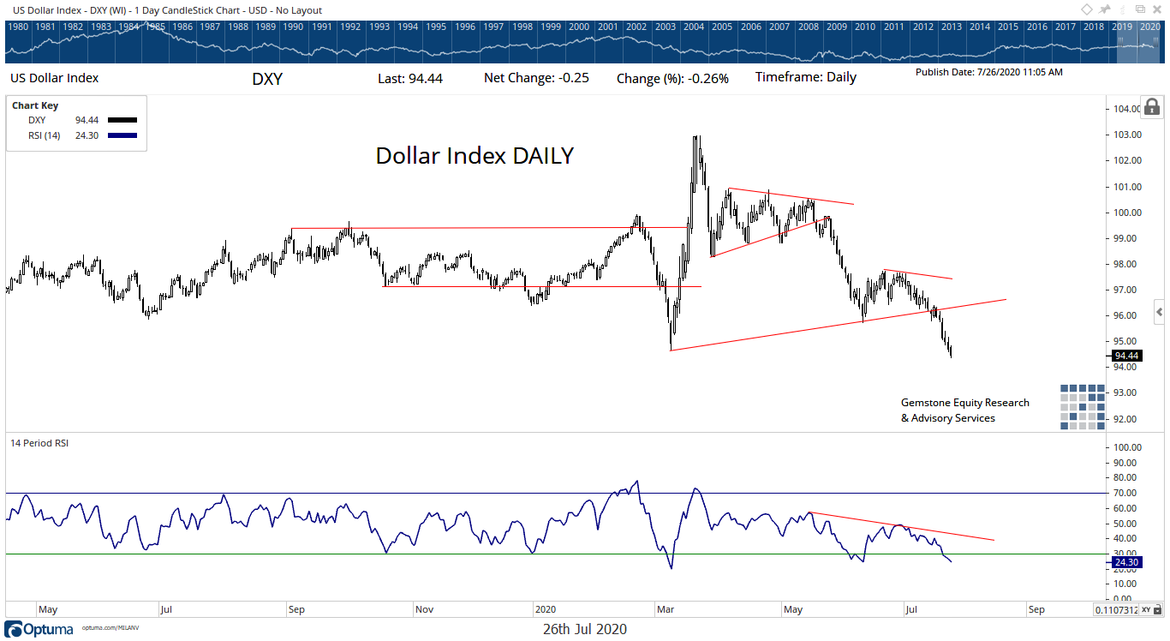
The Daily chart of Dollar Index (DXY) needs to explanation. It is evidently weak with every possible zone taken out on the downside. More insights are derived from the weekly chart below.
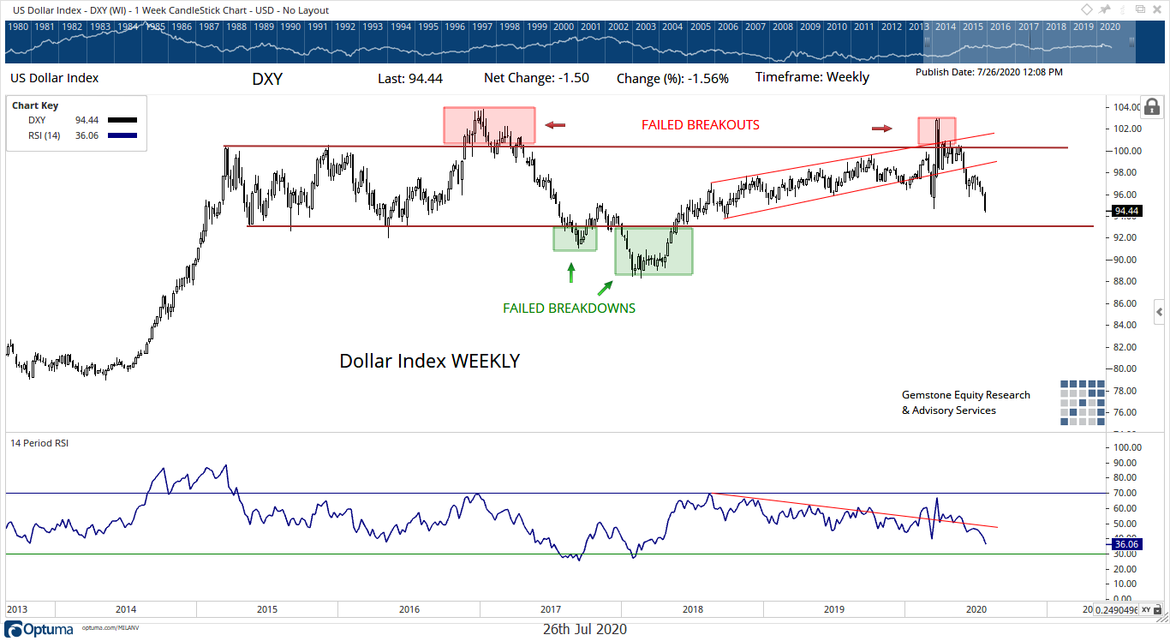
In the weekly chart above, notice that after a sharp rally in 2014-2015 which took the Dollar Index from 76 to 100, DXY has been in a massive sideways move over the past five years. It suffered two failed breakout and two failed breakdowns with neither of them materializing in any change of trend. In the large ranged movement, we also see a mildly upward rising channel also breaking down in between. All during these times, the RSI had continuously had a bearish divergence while making lower tops.
If the present trajectory continues, seeing the DXY testing 93.50 – 93 in the near term should not be a surprise even if it stabilizes in the immediate short term.
The weakness of the Dollar Index is also visible the way the other currencies are behaving against the greenback as reflected in the Forex Relative Rotation Graph below.
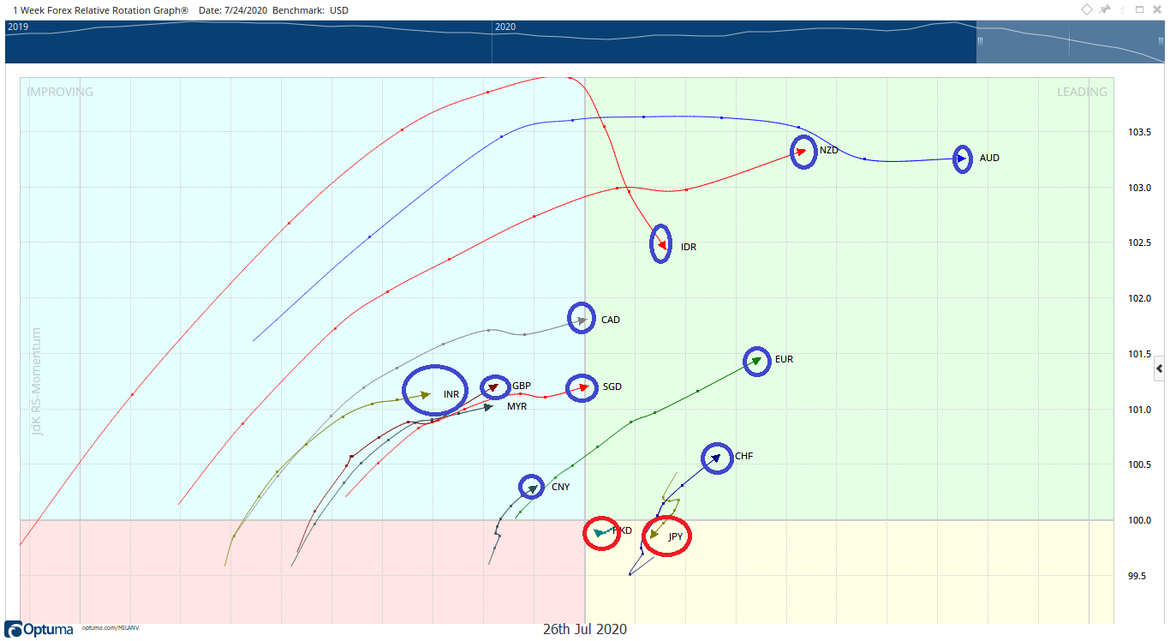
In the above Relative Rotation Graph (RRG), we see that all major currencies like Australian Dollar, Indonesian Rupiah, NZ Dollar, Canadian Dollar, Singapore Dollar, British Pound, Indian Rupee, Chinese Yuan, etc. are rotating positively and relatively outperforming the Dollar. It is only the Japanese Yen that is not favorably placed against the Dollar. All these currencies are benchmarked against the US Dollar.
It is only this Relative Rotation Chart that might be showing some very early signs of the equity markets cooling down, but still continuing to relatively outperform the other asset class.
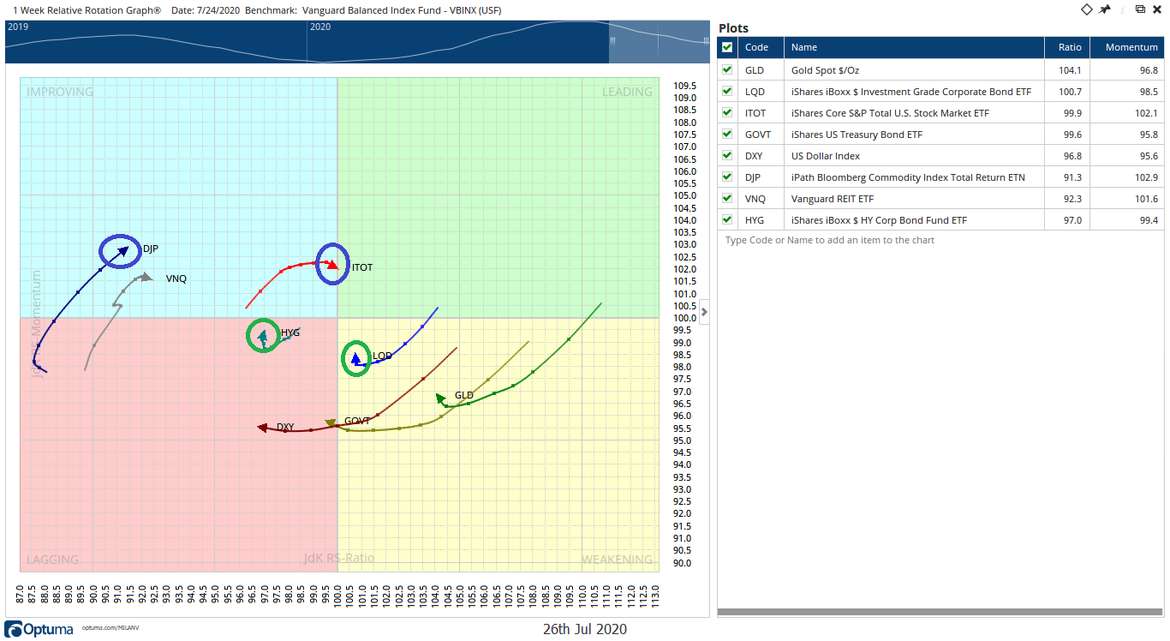
The risk-on environment that started exactly 8 weeks ago, continues to be comfortably in place at this point in time. The Equity, as an asset class is represented by ITOT (iShares Core S&P US Stock Market ETF). It is presently on the verge of entering the leading quadrant, though it mildly appears to be tapering off on the relative momentum front. But, that does not represent any immediate signs of worry. Followed by that is the Commodities, represented by DJP (iPath Bloomberg Commodity Index Total Return ETN).
We will have a reason to worry only when the Asset classes like Bonds and Gold start moving towards the improving quadrant; it appears that they have a large distance to cover at this point in time. All these assets are benchmarked against VBINX – Vanguard Balanced Index Fund.
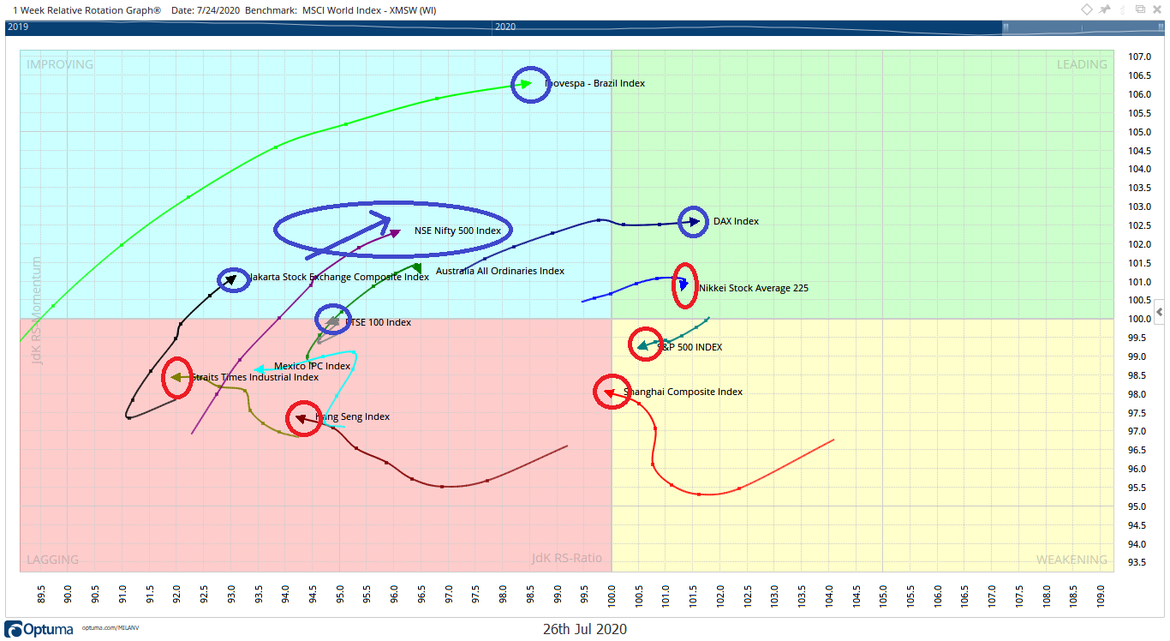
As at this point in time, Indian Equity Markets are better placed. When compared against MSCI World Index, the broader NIFTY500 Index is placed in the improving quadrant and it may relatively outperform the other Asian peers like Hang Seng, Straits Singapore, Shanghai Composite, and even S&P 500 Index on relative terms.
This was first published by The Economic Times.
Milan Vaishnav, CMT, MSTA
Consulting Technical Analyst
Member: (CMT Association, USA | CSTA, Canada | STA, UK) | (Research Analyst, SEBI Reg. No. INH000003341)
Categories
RECEIVE FREE! – Weekly Market Outlook and all Special Articles when published

