In the discipline of Technical Analysis, there are patterns that can be classified as Reversal Patterns or Continuation Patterns. Where Reversal patterns tend to reverse the prior trend; Continuation patterns tend to resolve in the direction of the prior trend.
One such “Reversal Pattern” is the Inverted (Or, Inverse) Head and Shoulders Pattern which is considered a bullish reversal pattern. This is the exact opposite of Head and Shoulders which is one of the major bearish reversal patterns.
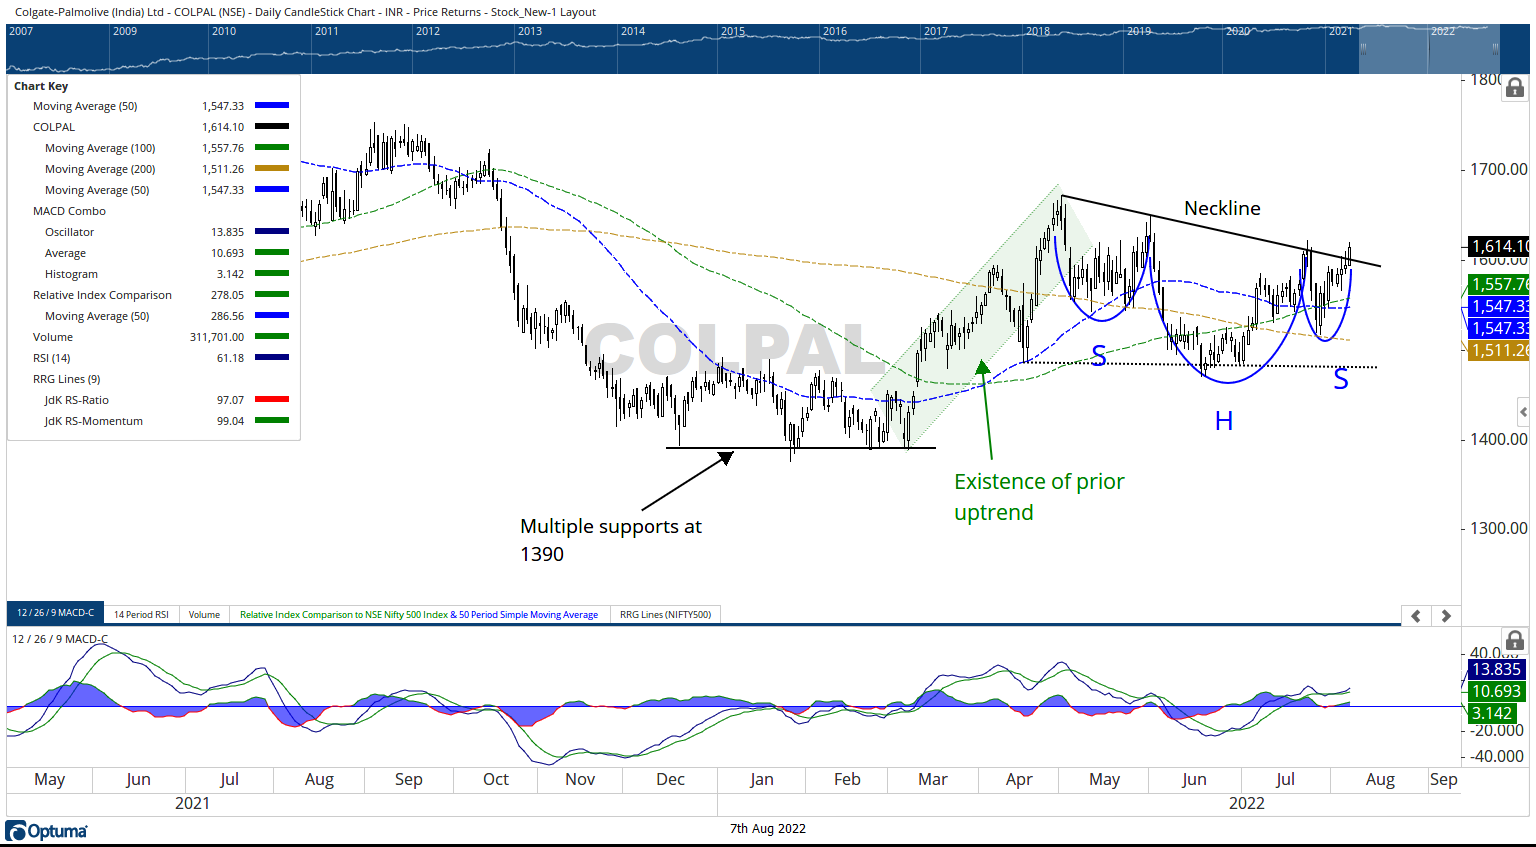
However, there are times, when this bullish reversal pattern — Inverted Head & Shoulders often acts as a “Continuation Pattern”; during the such instance, such a pattern developed following an existing uptrend and results in the continuation of the uptrend. The most recent example of this happening is seen on Colgate Palmolive (India) Ltd — COLPAL chart.

COLPAL peaked at 1823.40 in July 2021, after that it s stayed largely in a corrective trend. After the high of 1823.40, the price action subsequently marked lower highs near 1751, and 1824 before marking multiple support points near 1390. The prices took support here a number of times, the stock staged a rally from 1390 to test the most recent high point at 1672 in May 2022.
From May 2022 until today, the price action has resulted in a complex Inverse Head & Shoulder formation. Generally speaking, such inverted Head & Shoulder formation `is a bullish reversal pattern and generally emerges following a decline, in the present case, it has developed following a rally and may act as a continuation pattern.
This is not a classically flat inverse Head & Shoulder pattern, but a complex and sloping one. However, it is very much a valid one as it has developed over two months. The neckline is placed at 1600 and the stock has tried to stage a breakout from this pattern.
The RSI has marked a new 14-period high; however, it is neutral and does not show any divergence against the price. The MACD is bullish and above the signal line. Importantly, the Histogram is seen widening; this implies acceleration in the momentum on the upside.
If the present pattern resolves on the expected lines, the stock may test 1750-1785 levels. Major support at Close levels exists in form of 200-DMA placed currently at 1511. Any close below 1500 will negate this view.
Milan Vaishnav, CMT, MSTA
Consulting Technical Analyst
Member: (CMT Association, USA | CSTA, Canada | STA, UK) | (Research Analyst, SEBI Reg. No. INH000003341)
Categories
RECEIVE FREE! – Weekly Market Outlook and all Special Articles when published

