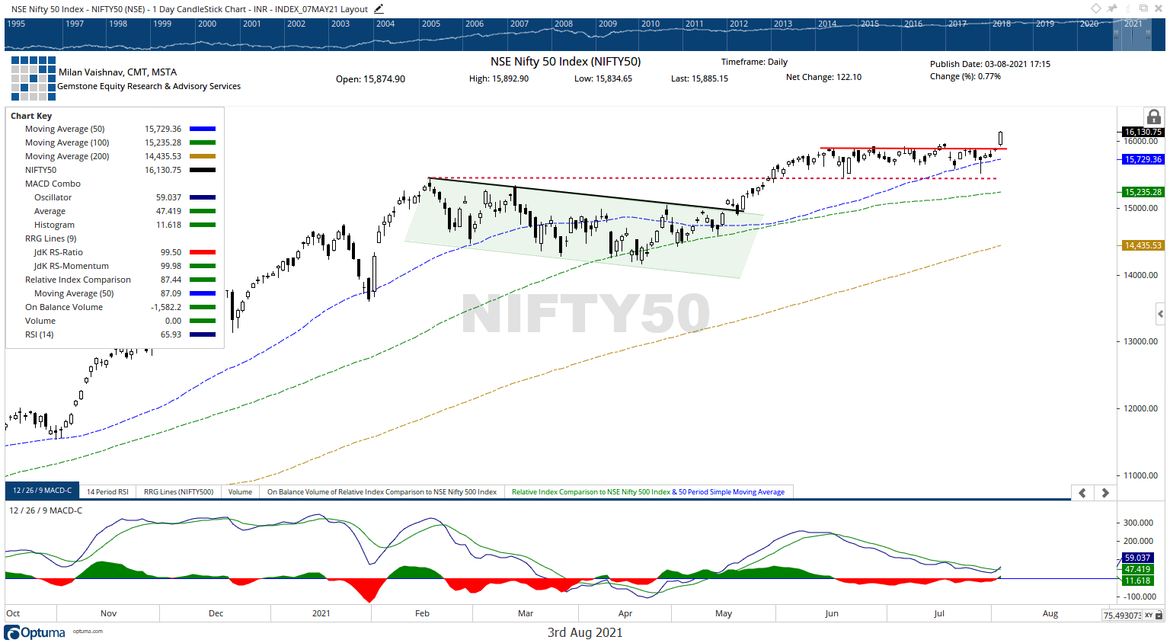
Following severe consolidation for over two months, the NIFTY finally broke out from the broad consolidation zone and ended the day on a very strong note. The markets saw themselves opening on a positive note. However, it traded in a capped zone in the first hour of the trade; after that, the markets just grew stronger. After maintaining steady gains near the key resistance area, the Index saw a sharp incremental move on the higher side and went past 16150 levels. While maintaining gains with good market breadth, the NIFTY ended with strong gains of 245.60 points (+1.55%).

Tuesday’s session has been very significant from a technical perspective. The NIFTY has taken out the resistance zone of 15900-15950 after eight weeks of resistance to this area. This resistance, since it is taken out convincingly, has now become an immediate support zone for the markets. This means that so long as the NIFTY keeps its head above the 15900-15950 area, the breakout will remain valid and in force. Volatility also spiked; INDIAVIX rose by 7.36% to 13.7475.
Wednesday is likely to see the levels of 16200 and 16245 acting as resistance; since NIFTY is now in uncharted territory, resistance levels are judged using the options data. The supports on the lower side may come at 16030 and 15950 levels.
The Relative Strength Index on the daily chart is 65.93; it has marked a new 14-period high which is bullish. RSI is however neutral and does not show any divergence against the price. The daily MACD has shown a positive crossover; it is now bullish and trades above the signal line.
A rising window occurred; further to this, it is not only a gap but a breakaway gap. Such patterns get mostly resolved in the direction of the move.
The pattern analysis shows the NIFTY breaking out from a 2-month long consolidation. This has made the resistance area of 15900-15900 its most immediate support if the markets consolidate once again in the near term.
All in all, given the strength of the breakout, it is unlikely that the markets may show any intention of any immediate corrective move. However, if the present breakout is read in conjunction with the longer-term weekly charts, the NIFTY has halted just near its resistance level that exits in form of a rising trend line.
In the given technical structure on the daily and the weekly charts, we recommend doing two things. First, looking at the strength of the breakout on the daily charts, shorts should be best avoided. Fresh purchases should be kept focused on defensive stocks and largely within the large caps and frontline stocks while maintaining a cautiously positive outlook for the day.
This was first published by The Economic Times.
Milan Vaishnav, CMT, MSTA
Consulting Technical Analyst
Member: (CMT Association, USA | CSTA, Canada | STA, UK) | (Research Analyst, SEBI Reg. No. INH000003341)
Categories
RECEIVE FREE! – Weekly Market Outlook and all Special Articles when published

