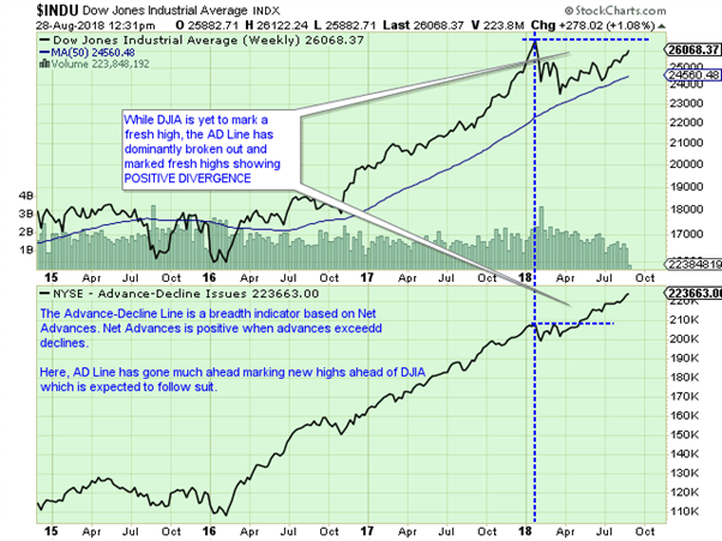
Dow Jones Industrial Index – DJIA which has resumed its up move after some prolonged consolidation that begins after the Index hit its lifetime high of 26616.71 on January 06, 2018. During corrective retracement that followed, it tested 23360 and thereafter remained in ranged consolidation in a side-ward trajectory in a broad range. In the process, it took support for the number of times at or near its 50wMA as evident in the Chart.
After retracing and seeing a corrective move by paring nearly 13% from the high point, the DJIA Index has resumed its up move and it has shown all likelihood of testing its previous high of 26616 and even moving past that level.
US Markets are slated to test their previous highs and even move past them if as indicated by very important Breadth Indicator, i.e. Advance-Decline Line.
The Advance-Decline Line (AD Line) is a breadth indicator based on Net Advances, which is the number of advancing stocks less the number of declining stocks. Net Advances are positive when advances exceed declines and negative when declines exceed advances. The AD Line is a cumulative measure of Net Advances. The present scenario represents Bullish Divergence. It means that though Dow has not made fresh highs, the AD Line has gone on to make fresh highs. The AD Line is a breadth indicator that reflects participation. A broad-based advance shows underlying strength that lifts most boats. It will be no surprise if we see DOW marking fresh highs on an immediate short to medium-term note.
Milan Vaishnav, CMT, MSTA
Consulting Technical Analyst
Member: (CMT Association, USA | CSTA, Canada | STA, UK) | (Research Analyst, SEBI Reg. No. INH000003341)
Categories
RECEIVE FREE! – Weekly Market Outlook and all Special Articles when published

