Following a brutal decline that the NIFTY witnessed beginning September 2018, the index found its support just below the 10,000 marks and witnessed a technical pullback. This technical pullback halted near the 10950 levels in early December 2018. Since then, for the next two months, the index has resisted multiple times and has remained unsuccessful to move past this level.
While we attempt once again to go near this level and make efforts to take out this immediate and important resistance area, we need to take a hard look at what it will take for the markets to give a sustainable breakout above this point.
Whenever any market attempts a breakout, it requires strength and all-around participation (at least larger participation) to make it sustainable. At this point, Market Breadth comes into the picture. Market breadth is a technique used in technical analysis that attempts to gauge the direction of the overall market. Market breadth indicators analyze the number of companies advancing relative to those declining. Rallies that have a higher number of stocks participating are often known to sustain for a longer duration.
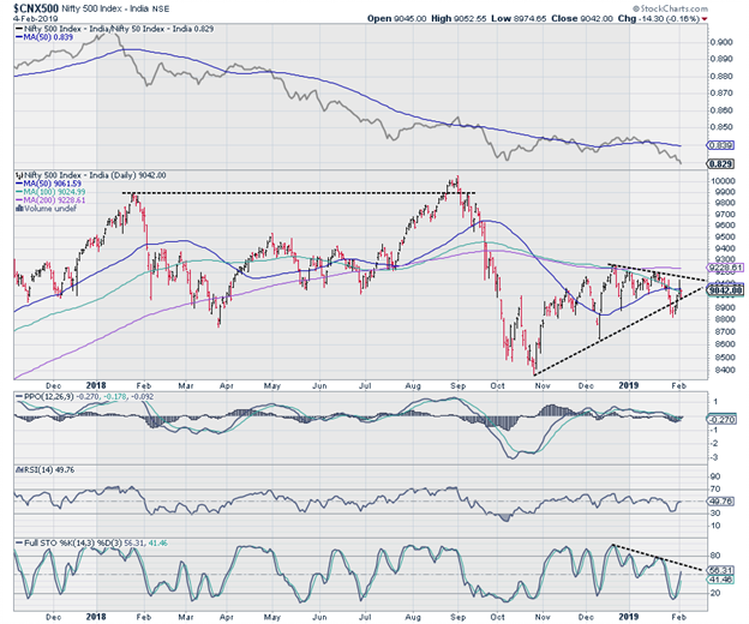
While we speak of the overall health of the market or the sustainability of any anticipated breakout, a look at the market breadth of the market is required the contribution to the breadth comes from the Broader Markets. A close look at $CNX500 Index which represents the broader market throws up some interesting insights.
CNX500 Index, with 501 stocks as its constituents, represents over 95% of the free float market cap.

The chart shown above is the daily chart of the CNX500 index. After marking a double top near 10,000 and subsequent corrective move, the index rebounded from just below the 8400 mark, the index made higher bottoms but presently it is seen trapped in a narrow range in a symmetrical triangle formation. A strong move would occur only after the index moves out of this range and after the 200-DMA of 9061 is taken out.
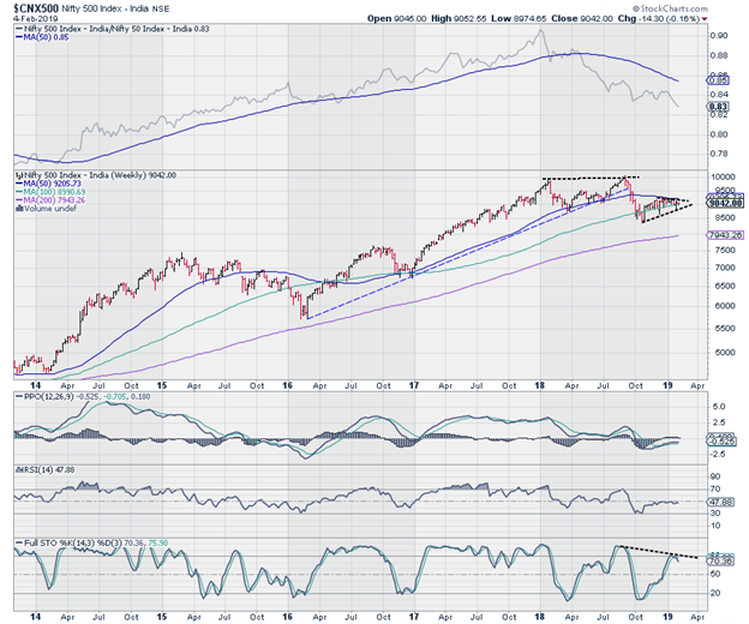
If we zoom out and take a larger view through a weekly chart of CNX500, it presents a similar story.

Milan Vaishnav, CMT, MSTA
Consulting Technical Analyst
Member: (CMT Association, USA | CSTA, Canada | STA, UK) | (Research Analyst, SEBI Reg. No. INH000003341)
Categories
RECEIVE FREE! – Weekly Market Outlook and all Special Articles when published

