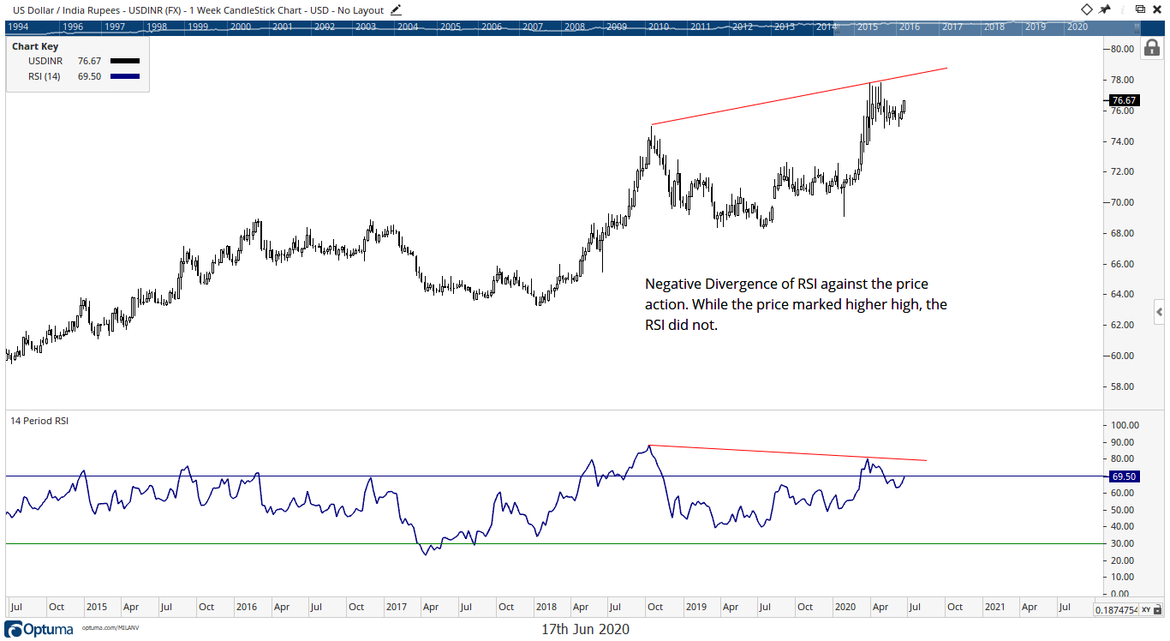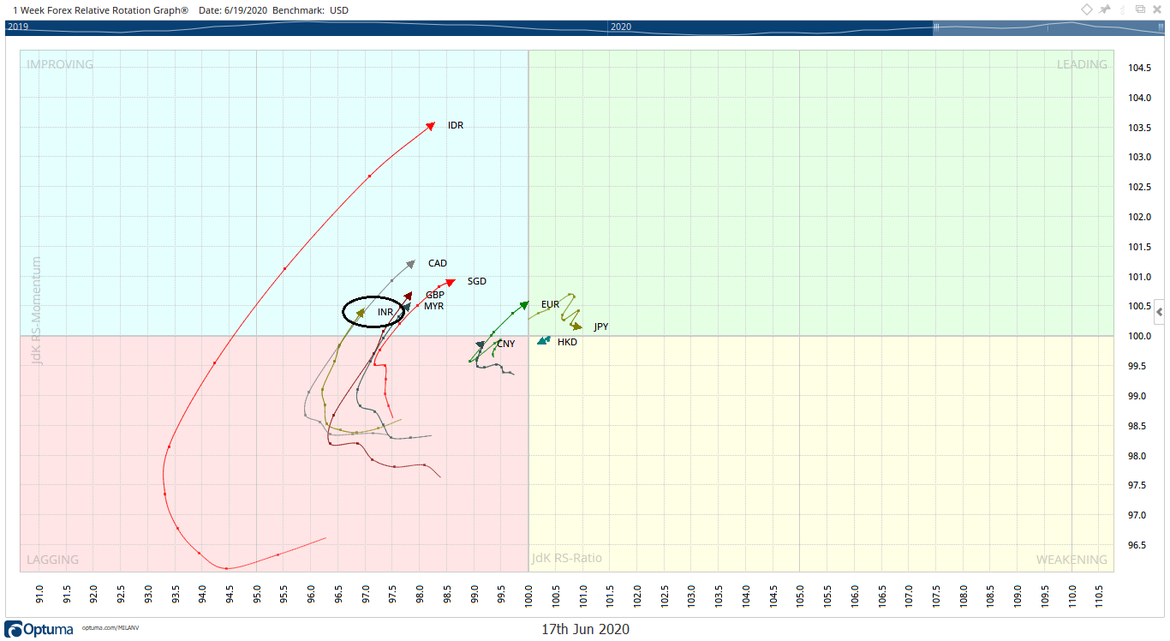
The below chart shows that the RSI has shown a clear bearish divergence as it did not mark higher highs along with the USDINR Price. This shows lack of internal strength of USD against the Rupee.When we benchmark Indian Rupee along with other major currencies against the US Dollar, it has moved inside the improving quadrant.

Not only has the Indian Rupee moved in the improving quadrant, but it has also shown a strong North-East rotation showing strong relative momentum against the USD.
Relative Strength Index (RSI) is different from RS, i.e. Relative Strength. We use this Momentum Indicator to compare the movement of the security/instrument against its own self and measure its momentum and strength against its own, usually over the past 14 days.
Relative Strength Index and Market Breadth can be used to identify major trends and profitable setups. I shall discuss this in detail in our upcoming Webinar “Understanding Market Breadth and Using Relative Strength Index For Profitable Trade Setups”, this Saturday, June 20, 2020.
This was first published by The Economic Times.
Milan Vaishnav, CMT, MSTA
Consulting Technical Analyst
Member: (CMT Association, USA | CSTA, Canada | STA, UK) | (Research Analyst, SEBI Reg. No. INH000003341)
Categories
RECEIVE FREE! – Weekly Market Outlook and all Special Articles when published

