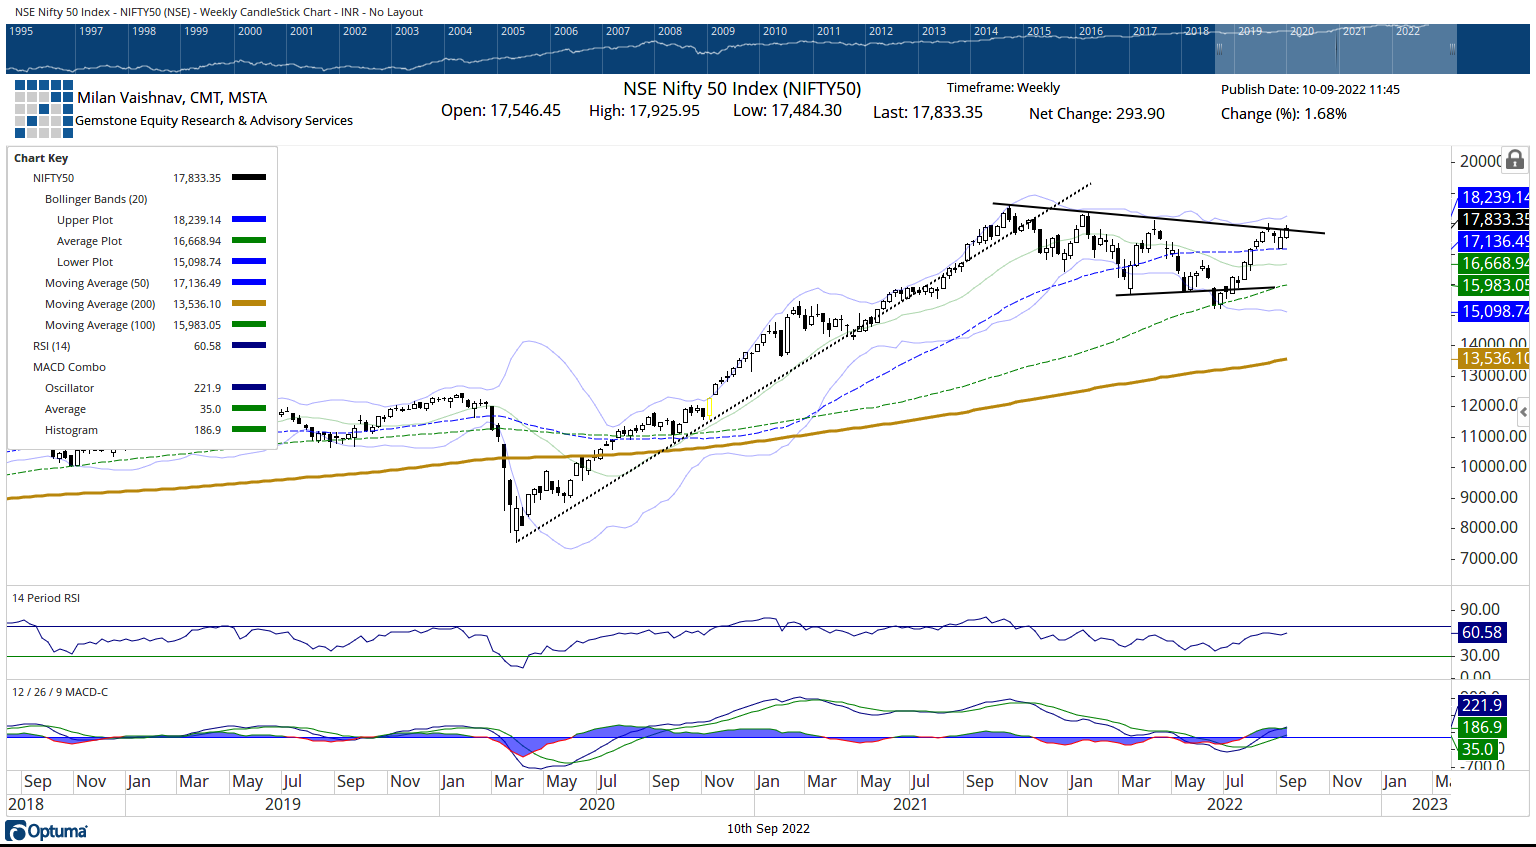
In the previous weekly technical note, it was categorically mentioned that the markets have created a defined trading zone for themselves. This trading zone had the 50-Week MA as its lower support area; the upper resistance existed near the 17600-17700 area. After a flat ending in the week before this one, the past five sessions remained quite trending in nature for the markets. The markets have made a strong attempt to break above the upper edge of the defined resistance zone and in the process have created some room for themselves on the upside. The trading range for the NIFTY over the previous week was that of 441.65 points and it has ended just at the falling trend line pattern resistance area. Following a relatively much stronger week, the NIFTY ended with a net gain of 293.90 points (+1.68%) on a weekly note.

The markets have spent many days resisting the important pattern resistance that exists in form of a falling trend line. This was a significant resistance as this falling trend line began from the lifetime high point of 18600 and joined the subsequent lower tops. Given the falling nature of this trend line, the most recent resistance remained in the 17600-17650 zone which the markets have taken out on a closing basis as of the previous session’s close. If the NIFTY opens higher in the coming week and sustains above this zone, the index may open up some more upside for itself towards 18000 and higher. The volatility also subsided; INDIAVIX slipped by 9.37% to 17.72 on a closing basis.
Over the coming week, any move and sustenance above the current levels are likely to lead to a breakout. The levels of 18000 and 18195 are likely to act as potential resistance points. The supports come in at 17700 and 17580 levels. The coming week is likely to see a trading range that may remain wider than usual.
The weekly RSI is 60.58; it has made a 14-period high which is bullish. The RSI also remains neutral and does not show any divergence against the price. The weekly MACD is bullish and above the signal line. The Histogram is widening; this shows an acceleration of the momentum on the upside.
The pattern analysis of the weekly charts shows that the markets have made a strong attempt to break above the significant falling trend line pattern resistance. This is important technical development as the referred trend line begins from the lifetime high point of 18600 and joins the subsequent lower tops. Any sustained move above the current levels will entail a strong breakout on the upside.
All in all, sustenance of the markets above the 17700 levels would be very crucial; if this happens, then we may find the markets opening some more room on the upside for themselves. If the upside continues, then we are also likely to see some improved performance from the midcaps and the broader markets. It is strongly suggested that shorts may be avoided; even if some consolidation happens, that downside must be utilized to make fresh purchases so long as NIFTY keeps its head above 17600 levels. A positive outlook is advised for the coming week.
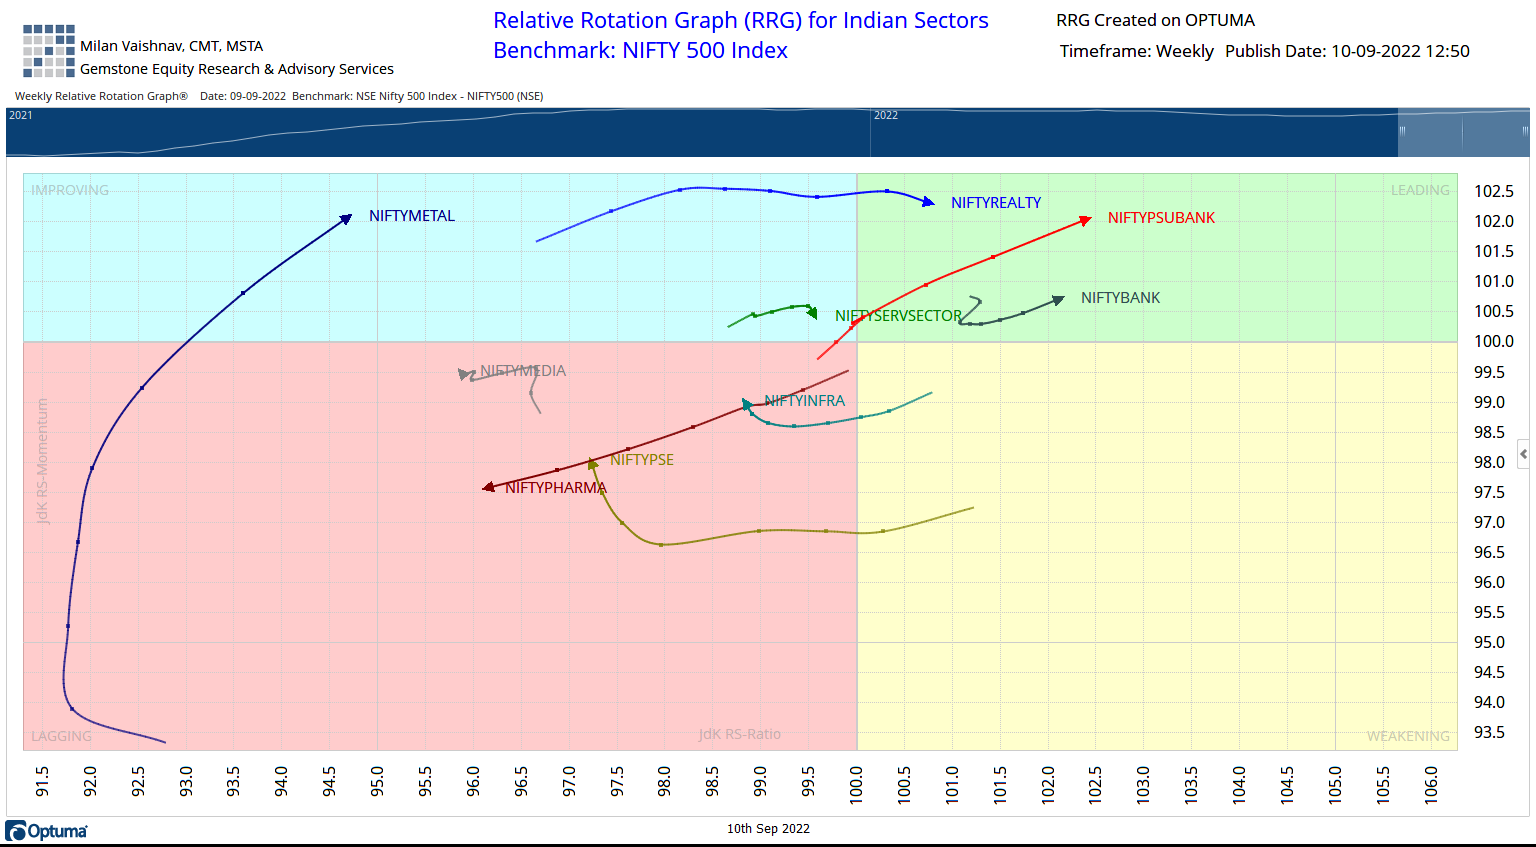
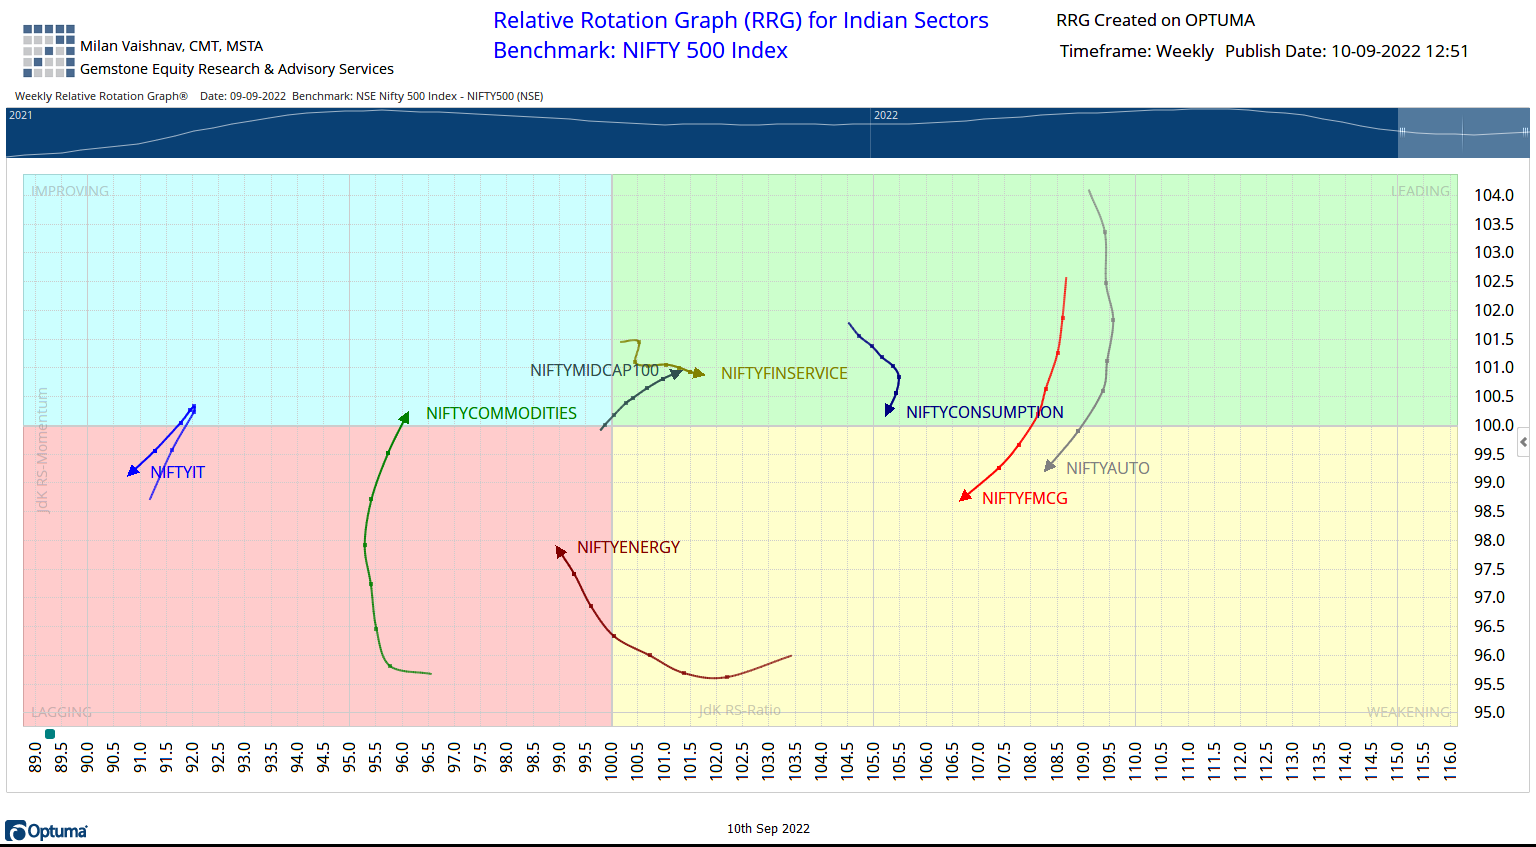
In our look at Relative Rotation Graphs®, we compared various sectors against CNX500 (NIFTY 500 Index), which represents over 95% of the free float market cap of all the stocks listed.


The analysis of Relative Rotation Graphs (RRG) NIFTY Consumption remains in the leading quadrant but is seen rapidly paring its relative momentum against the broader markets. It may soon join NIFTY FMCG and Auto indexes that are seen in the weakening quadrant. Besides this, NIFTY Realty, Banknifty, Financial Services, Midcap 100, Realty, and PSU Bank indexes are inside the leading quadrant and may continue to relatively outperform the broader markets.
NIFTY Pharma, Media, and IT indexes are seen languishing inside the lagging quadrant.
The Infrastructure, Energy, and PSE indexes are also inside the lagging quadrant; however, they are seen improving on their relative momentum against the broader NIFTY500 index.
NIFTY Commodities Index has entered the improving quadrant. This hints at a potential end to its relative underperformance. Apart from this, NIFTY Metal is also seen advancing firmly inside the improving quadrant.
Important Note: RRG™ charts show the relative strength and momentum for a group of stocks. In the above Chart, they show relative performance against NIFTY500 Index (Broader Markets) and should not be used directly as buy or sell signals.
This was first published by The Economic Times.
Milan Vaishnav, CMT, MSTA
Consulting Technical Analyst
Member: (CMT Association, USA | CSTA, Canada | STA, UK) | (Research Analyst, SEBI Reg. No. INH000003341)
Categories
RECEIVE FREE! – Weekly Market Outlook and all Special Articles when published

